AARNet
AARNet
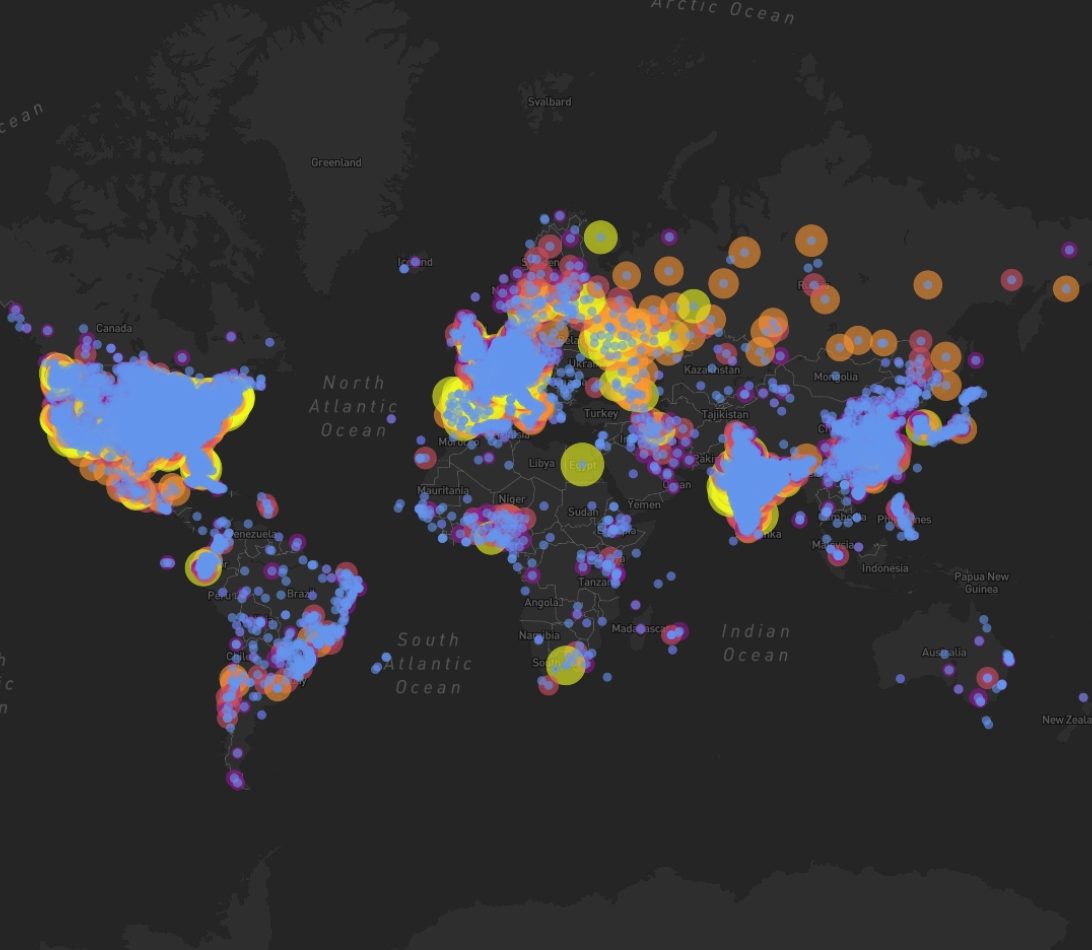
Screenshot of Healthmap world map visualising COVID-19 data. Source: healthmap.org
Updated 27 July, 2020
In the past few months data about the COVID-19 pandemic has been collected, aggregated and analysed at a rapid pace. As data is collected, published and updated daily worldwide, the coronavirus outbreak may become the most visualised data ever.
To help improve the timely access to data in the COVID-19 emergency the World Health Organisation (WHO) have implemented “COVID-19 Open”, a data sharing and reporting protocol, that encourages researchers to share data as quickly and widely as possible. Rapid data sharing is imperative for public health action in the fight against COVID-19, and WHO have stressed the importance of the continued open sharing of worldwide data and results to assist decision makers and health authorities.
Shortly after the COVID-19 outbreak was reported in China publicly available data has been aggregated, summarised, monitored and visualised, outlining the spread of the disease worldwide. The number of affected countries, people, tests, deaths and recoveries related to the virus are reported daily and this health data is openly available in a way never seen before.
Open source data sets have been a helpful resource, researchers and data scientists have been pulling together data from multiple sources and made this publicly available on sites such as GitHub and Kaggle. Dashboards are a popular tool used to visually represent the spread of the disease, with the most popular being the John Hopkins University dashboard, these tools provide an effective summary and up-to-date key information for monitoring the data.
Data experts in the Research Data Alliance (RDA) have also swiftly come together to tackle COVID-19. As an international, consensus-driven, community-based organisation, the RDA was approached to leverage on the global RDA data community to support the urgent Coronavirus COVID-19 pandemic. In response, RDA has set up a fast track Working Group titled the “RDA COVID-19 Working Group”, whose objective is to clearly define detailed guidelines on data sharing and re-use under the present COVID-19 circumstances to help researchers follow best practices to maximize the efficiency of their work. The guidelines will focus on the management of data originating from different data sources and the development of a system for data sharing in public health emergencies that supports scientific research.
As part of our response to the ongoing COVID-19 pandemic across the world, AARNet has gathered content from online resources that are freely accessible to assist researchers and any others who want to explore the data further.
List of resources
A comprehensive list of resources for researchers to access available data efficiently, including raw static datasets and links to updated data and useful resources to worldwide data on COVID-19.
https://cloudstor.aarnet.edu.au/plus/s/iUPnVvHu3ocu8ai
Healthmap aggregates Australian health and demographic data, and have added local COVID-19, ECDC and Johns Hopkins University data. For easy reference and re-use by others they have released a single standalone COVID-19 map that combines all these sources.
https://maps.healthmap.com.au/gDz
Access to the data file curated by the European Centre for Disease Prevention and Control, updated daily and containing the latest available public worldwide data on COVID-19
https://www.ecdc.europa.eu/en/geographical-distribution-2019-ncov-cases
Led by HealthMap this COVID-19 global map visualises a deep and meticulous data set that is freely accessible to any researcher.
This repository contains Jupyter notebooks and python scripts for investigating the 2019 coronavirus outbreak.
https://github.com/pdtyreus/coronavirus-ds
This site accumulates the information and data from numerous sources to show the latest status of COVID-19 in Australia.
Authors: Gen Rosewall, Health and Medical Community Liaison, AARNet and Dr Frankie Stevens, Associate Director eResearch, AARNet